Technical analysis is an important lesson that leads to successful Forex trades.
One of the most basic aspect of technical analysis is a trader’s ability to interpret charts and graphs.
Sure, there are Expert Advisors (EAs) and copy traders whom we can depend on, but knowing the basics helps a trader to observe and recognize trading opportunities. Bots are precise and accurate, yet from time to time the market expresses its changing sentiments.
As trading involves sentimental analysis, these knowledge will prove to be useful.
3 Types Of Graphs You Must Know
1. Line Graph
A line graph shows only the highs and lows of a currency pair. Lines are drawn across these dots that connect, thus its name.
2. Bar Graph
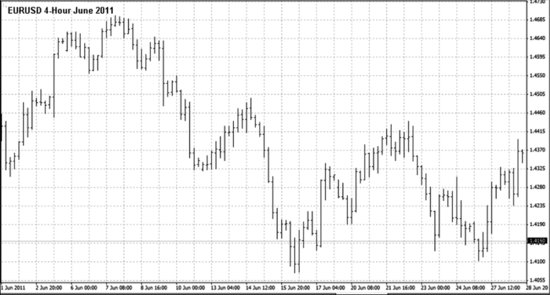
A bar graph however is slightly more advanced. It shows the open, high, low and close (OHLC) of a currency pair.
3. Japanese Candlesticks
Japanese candlesticks has similar technicalities to a bar graph. Its appearance however, is slightly different. Candlesticks have real body.
What Is A Real Body?
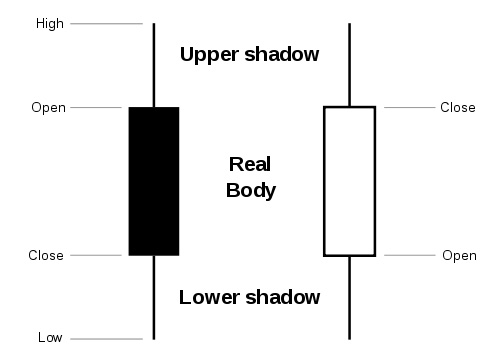
When you switch your graph to Japanese Candlesticks, you will see black and white rectangles with vertical lines (long or short) at both endsA white real body shows a bullish price action, while a black body signals a bearish pattern. On the upper and lower end of the real body, there are vertical lines called shadows, which show traders the highest and lowest bid price during a trade session. Japanese candlesticks provide very useful information in great details. For this reason, beginner traders are encouraged to study, learn and apply the knowledge on practice trading sessions using candlestick charts.
Long Body vs Short Body
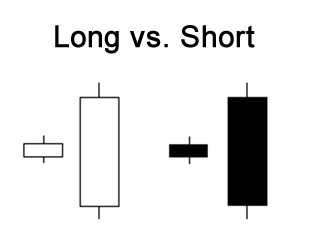
The longer the real body, the stronger the pressure between buyers and sellers. A short body shows little price movement, thus signs of indecision between bulls and bears.
Long White vs Short White
When a price opens low, bulls rush into the market, forcing the price to ascend, and a long white body results. This indicates a strong buying pressure. However a short white body forms when bulls are being pushed back by the bears, and eventually gaining control again over the market, closing the price just slightly above the open.
Long Black vs Short Black
Price opens high, bears slam the market, bringing the price further down, thus a long black body. Strong selling pressure is signaled. The low of lower shadow on a short black body shows us that sellers were active during the trade session. However, the bulls catch up eventually, forcing the price to rocket in ascension, closing the trade slightly below the open.
Long Shadow vs Short Shadow
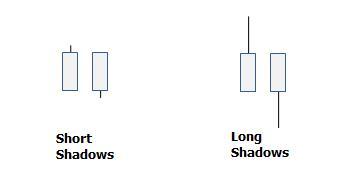 Shadows are indicators of the highest and lowest bid price during a trade session. The longer the upper shadow, the greater number of buyers dominate a session. The longer the lower shadow, the more sellers are powering a trade. Colors of the real body don’t matter much, since upper shadows are buying regions, and lower shadows are areas of active bears.
Marubozu
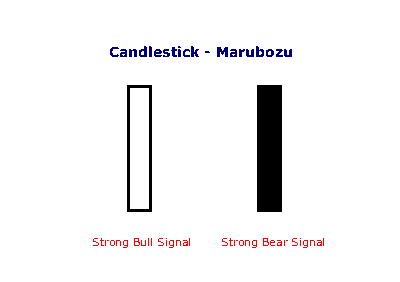 Candlesticks without shadows are called Marubozu. A white Marubozu indicates that the bulls are in control of the domain, while a black Marubozu shows us that the bears are in throne.
Spinning Tops
 Spinning tops are candlesticks with short real boy, long upper and lower shadow. Its short body tells us there is little movement between opening and closing price. However, its long upper and lower shadow show active bullish and bearish trades during the session. Active they are, neither the buyers nor sellers manage to get an upper hand, resulting in a standoff. It shows a potential change or interference when preceded by a long candlestick. However, a further confirmation is required to make the best trading decision.
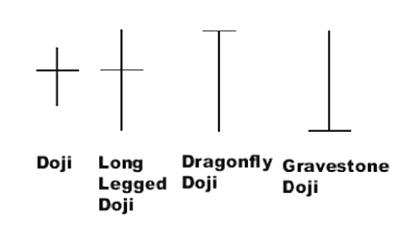
Doji
Doji are pretty simple to recognize- the have the same open and close price. A doji shows indecision between buy and sell, like a tug-o-war between the bulls and bears. When seen, a turning point could be developing. There are 4 types of Doji:
- Long-legged Doji
- Dragonfly Doji
- Gravestone Doji
- Four Price Doji
Doji Trend
Long White + Doji
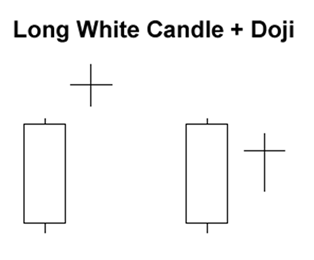 Doji are signs of probable turning points. When seen antecedent to a long white candlestick, a buying pressure could be showing signs of thinning. An uptrend may be coming to an end, however requiring a further bearish confirmation. Like, a long black or a decline below the white.
Long Black + Doji
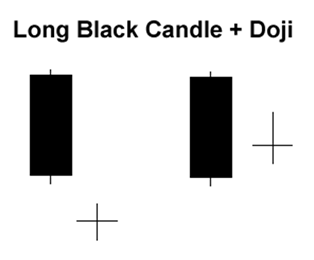 When a doji follows a long black candlestick, it shows signs of weakening bearish pressure and an end to a downtrend. Further bullish confirmation takes form of a long white, or a rise above the black.
Reversal Patterns
Prior Trend
What makes a pattern qualified as a reversal pattern largely depends on its prior trend. A bullish reversal pattern precedes a downtrend. Conversely, a bearish reversal pattern precedes an uptrend.
Long Shadow Reversals
There are 3 essential criteria to identify a long shadow reversal:
- Short real body
- Long shadow is at least two times the real body length
- Location of long shadow determines its classification
Hammer and Hanging Man
Trait: Long lower shadow, short upper shadow
 Hammer
Preceding a downtrend, a hammer shows signs of bullish revival. The low of lower shadow shows that sellers drove prices lower. However buyers eventually regained their footing, ending the session with a strong bull finish. A bullish confirmation, like a long white is further needed before making a trading decision.
Hanging Man
A hanging man comes after an uptrend, showing signs of bearish reversal. The low of long lower shadow indicates prices being pushed back by the bears. Selling pressure increases and raises a yellow flag, screaming for a bearish trend.
Inverted Hammer and Shooting Star
Trait: Long upper shadow, short lower shadow
 Inverted Hammer
The long upper shadow of an inverted hammer shows increasing buying pressure from the bulls. Its short body however, indicates that the bulls are unable to sustain their buying pressure and prices closed far off its highs. This calls for a bullish revival, when followed by a downtrend, and subsequently confirmed by a long white candlestick.
Shooting Star
When the price opens at low, bulls rally, but are slammed back to bottom by the bears, resulting in a long upper shadow. Since the bears are forcing prices down, a yellow flag is raised over signs of bearish reversal. A confirmation requires, in the form of a long black candlestick.